Texte
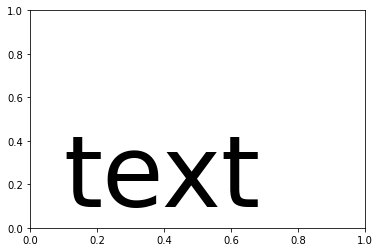
Il est possible d’ajouter du texte et même des formules mathématiques à un graphique.
plt.text(0.1, 0.1, 'text', fontsize=100);
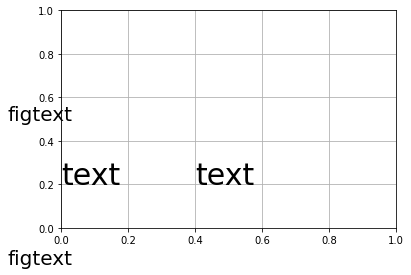
Ajouter du texte
La fonction
textajoute un text dans les axes,figtextajoute un text dans la figure.
plt.grid()
plt.text(0.0, 0.2, 'text', fontsize=30)
plt.text(0.4, 0.2, 'text', fontsize=30)
plt.figtext(0, 0, 'figtext', fontsize=20)
plt.figtext(0, 0.5, 'figtext', fontsize=20);
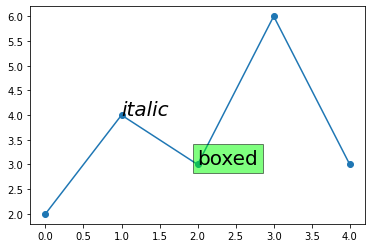
Texte avec bordure
L’objet Text a beaucoup d’options.
y = [2, 4, 3, 6, 3]
plt.plot(y, 'o-')
plt.text(1, y[1], 'italic', style='italic', fontsize=20)
plt.text(2, y[2], 'boxed', fontsize=20,
        bbox={'facecolor': 'lime', 'alpha': 0.5, 'pad': 5});
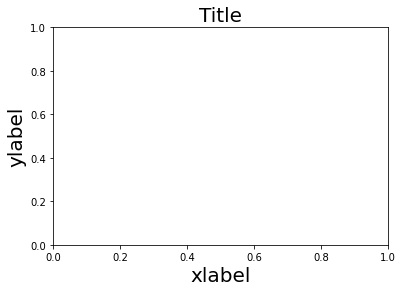
Étiquettes
Matplotlib possède les fonctions suivantes pour placer un titre et des étiquettes pour les axes x et y.
plt.title('Title', fontsize=20)
plt.xlabel('xlabel', fontsize=20)
plt.ylabel('ylabel', fontsize=20);
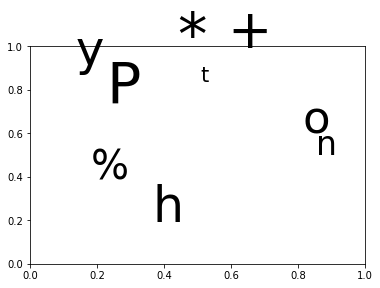
En position aléatoire
plt.subplot()
for c in 'Python %*+':
    s = np.random.randint(10, 60)
    plt.text(*np.random.rand(2), c, fontsize=s, ha='center')
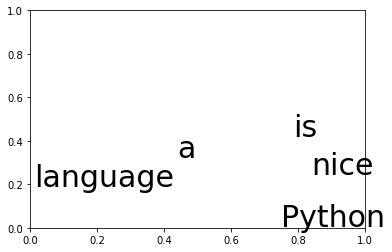
plt.subplot()
for c in 'Python is a nice language'.split():
    plt.text(*np.random.rand(2), c, fontsize=30)
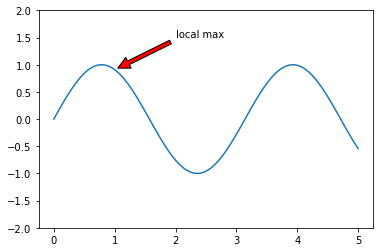
Annotation
t = np.linspace(0, 5, 100)
plt.plot(t, np.sin(2*t))
plt.annotate('local max', xy=(1, np.sin(2)), xytext=(2, 1.5),
             arrowprops=dict(facecolor='red', shrink=0.05))
plt.ylim(-2, 2)
(-2.0, 2.0)
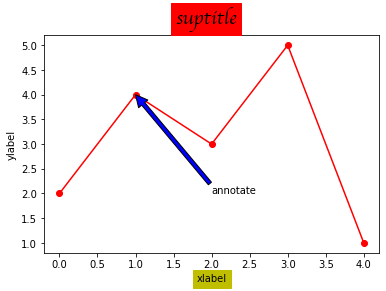
plt.suptitle('suptitle', fontsize=20, backgroundcolor='r', family='cursive')
plt.title('title')
plt.xlabel('xlabel', backgroundcolor='y')
plt.ylabel('ylabel')
plt.plot(x, y, 'ro-')
plt.annotate('annotate', (x[1], y[1]), (2, 2), arrowprops=dict(facecolor='b'))
Text(2, 2, 'annotate')
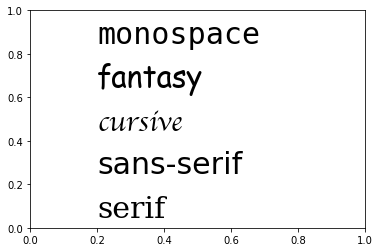
Police de caractère
styles = ['serif', 'sans-serif','cursive', 'fantasy', 'monospace']

for i, s in enumerate(styles):
    plt.text(0.2, 0.05+i/5, s, family=s, fontsize=30)
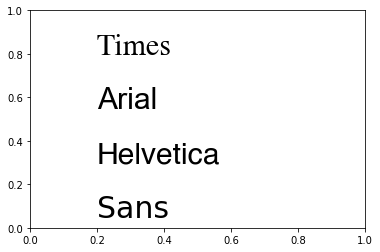
fonts = ['Sans', 'Helvetica', 'Arial', 'Times']
for i, s in enumerate(fonts):
    plt.text(0.2, 0.05+i/4, s, family=s, fontsize=30)
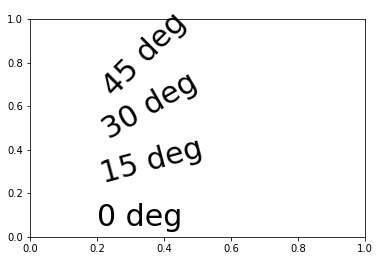
Rotation
L’angle du texte peut être choisi librement.
rotations = [0, 15, 30, 45]
for i, s in enumerate(rotations):
    plt.text(0.2, 0.05 + i/5, str(s)+' deg', rotation=s, fontsize=30)
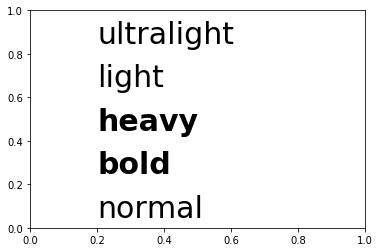
Poids
weights = ['normal', 'bold', 'heavy', 'light', 'ultralight']
for i, s in enumerate(weights):
    plt.text(0.2, 0.05+i/5, s, weight=s, fontsize=30)