Images
Charger une image
Pour charger des images, nous importons la fonction imread.
from matplotlib.image import imread
La fonction imread() peut importer deux types d’images
en couleur (RGB)
en noir et blanc (0..255)
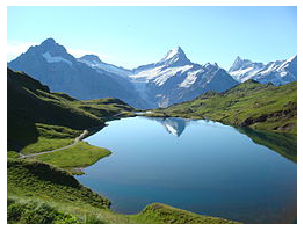
Voici une image en couleur
img = imread('img/Bachalpsee.jpg')
plt.imshow(img);
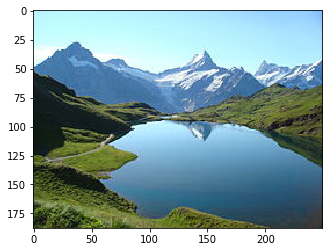
Voici les dimensions de la matrice:
188 pixelx en hauteur
250 pixels en largeur
3 octets pour définir une couleur
img.shape
(188, 250, 3)
Voici le pixel à la position (25, 25). C’est dans la région ciel et de couleur cyan. Les composant bleu et vert sont au maximum.
img[25, 25]
array([206, 255, 255], dtype=uint8)
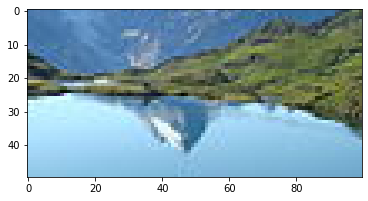
Indexer des pixels
Nous pouvons extraire une tranche d’une image. Dans une matrice, le premier indice est l’axe vertical (y) et le deuxième indice l’axe horizontal (x).
plt.imshow(img[70:120, 100:200]);
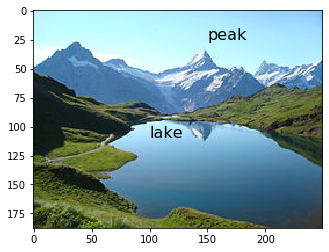
Annoter l’image
Nous pouvons superposer du texte à une image.
plt.imshow(img);
plt.text(150, 25, 'peak', fontsize=16)
plt.text(100, 110, 'lake', fontsize=16);
Afficher sans axes
La fonction axis('off') permet de ne pas afficher les axes.
plt.imshow(img)
plt.axis('off');
Noir et blanc
Les images noir-et-blancs sont affichées avec une colormap.
img = imread('img/lake.jpg')
plt.imshow(img, cmap='gray');
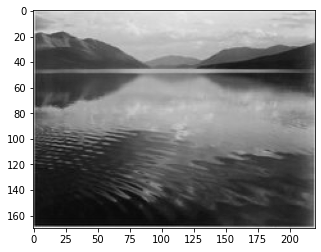
L’image est de taille 220x170 et du type ndarray.
img.shape
(170, 220)
type(img)
numpy.ndarray
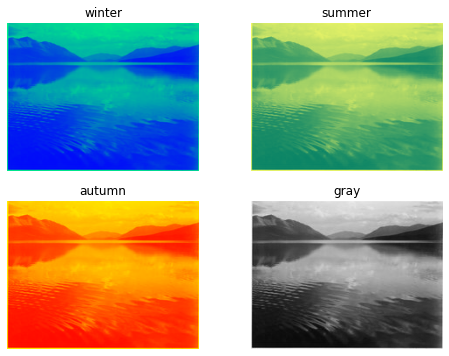
Color maps
Les images en noir et blanc (niveaux de gris) peuvent être coloriées avec des colormaps.
maps = ['winter', 'summer', 'autumn', 'gray']

plt.subplots(figsize=(8, 6))
for i in range(4):
    plt.subplot(2, 2, i+1)
    plt.imshow(img, cmap=maps[i])
    plt.axis('off')
    plt.title(maps[i])
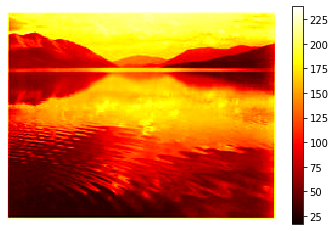
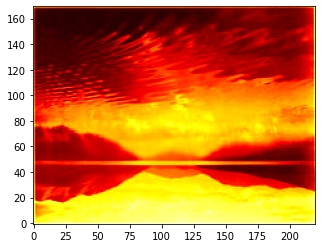
Barre des couleurs
La fonction colorbar() affiche une barre de couleur qui indique la correspondance des valeurs numériques et des couleurs.
    plt.imshow(img, cmap='hot')
    plt.axis('off')
    plt.colorbar();
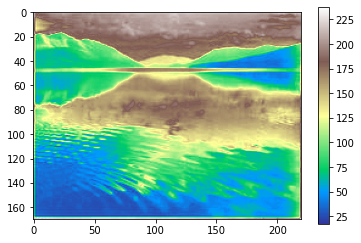
plt.imshow(img, cmap='terrain')
plt.colorbar();
Inverser
Pour inverser la direction de l’image, nous utilisons l’option origin.
plt.imshow(img, origin='lower', cmap='hot');
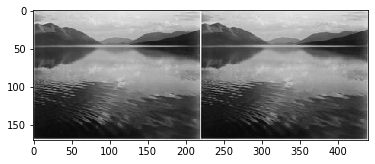
Juxtaposer
Avec la commande hstack (horizontal stack) nous pouvons juxtaposer des images.
a = np.hstack([img, img])
plt.imshow(a);
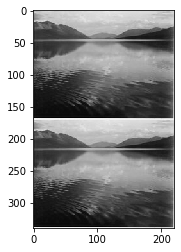
Superposer
Avec la commande vstack (horizontal stack) nous pouvons superposer des images.
a = np.vstack([img, img])
plt.imshow(a);
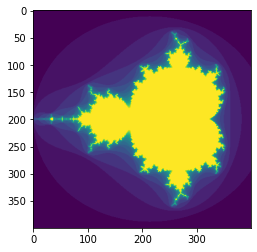
Mandelbrot
Pour terminer, calculons un fractal de Mandelbrot.
def mandelbrot(h, w, maxit=20):
    """Returns an image of the Mandelbrot fractal of size (h,w)."""
    y, x = np.ogrid[-1.4:1.4:h*1j, -2:0.8:w*1j]
    c = x + y*1j
    z = c
    divtime = maxit + np.zeros(z.shape, dtype=int)

    for i in range(maxit):
        z = z**2 + c
        diverge = z*np.conj(z) > 2**2         # who is diverging
        div_now = diverge & (divtime==maxit)  # who is diverging now
        divtime[div_now] = i                  # note when
        z[diverge] = 2                        # avoid diverging too much

    return divtime

plt.imshow(mandelbrot(400, 400));