Graphe polaire
Les coordonnées polaires sont un système à coordonnées à deux dimensions dans lequel chaque point est déterminé par un angle et une position.
La coordonnée radiale est appelée \(\rho\)
La coordonnée angulaire est appelée \(\theta\)
Points
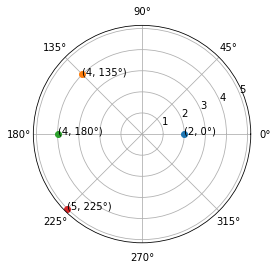
Un point (2, 0) est situé à une distance 2 et un angle de 0°.
points = ((2, 0), (4, 135), (4, 180), (5, 225))

for r, theta in points:
    t = theta/180*np.pi
    plt.polar(t, r, 'o')
    plt.text(t, r, f'({r}, {theta}°)')
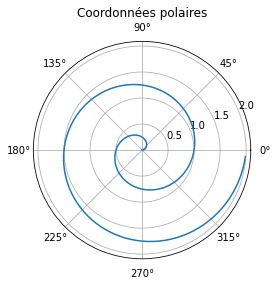
r = np.arange(0, 2, 0.01)
theta = 2 * np.pi * r

plt.polar(theta, r)
plt.gca().set_rticks([0.5, 1, 1.5, 2])
plt.title("Coordonnées polaires");
Cercle
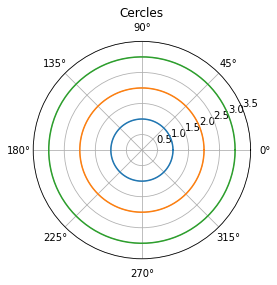
Un cercle centré sur l’origine est exprimé comme:
\[ r(\theta) = a \]
theta = np.linspace(0, 2*np.pi, 100)
r = np.ones(100)

plt.polar(theta, r)
plt.polar(theta, r*2)
plt.polar(theta, r*3)

plt.ylim(0, 3.5)
plt.title("Cercles");
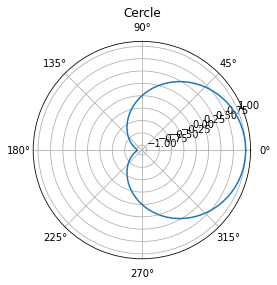
Un cercle passant par l’origine est exprimé comme:
\[ r(\theta) = a \]
theta = np.linspace(0, 2 * np.pi, 100)
plt.polar(theta, np.cos(theta))
plt.title("Cercle");
Rosace
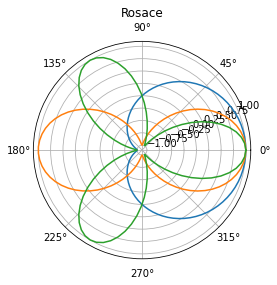
Une rosace est une courbe qui ressemble à des pétales de fleurs. Elle est exprimée par une simple équation polaire.
\[ r(\theta) = a \cos(k \theta + \phi_0) \]
theta = np.linspace(0, 2*np.pi, 100)
plt.polar(theta, np.cos(theta))
plt.polar(theta, np.cos(2 * theta))
plt.polar(theta, np.cos(3 * theta))
plt.title("Rosace");
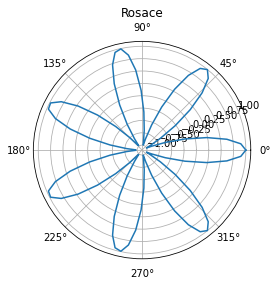
plt.polar(theta, np.cos(7 * theta))
plt.title("Rosace");
Spirale d’Archimède
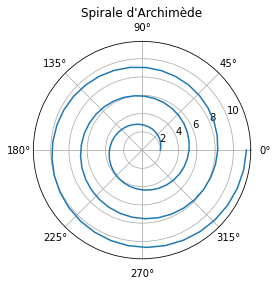
La spirale d’Archimède est une courbe découverte par Archimède. Elle est exprimée par une simple équation polaire.
\[ r(\theta) = a + b \theta \]
theta = np.linspace(0, 6*np.pi, 100)
plt.polar(theta, 2 + 0.5 * theta)
plt.title("Spirale d'Archimède");
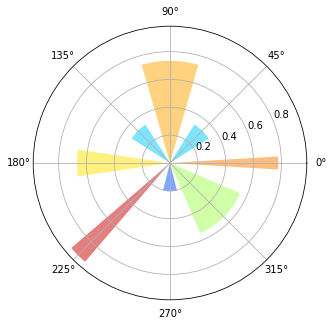
Radar plot
ax = plt.axes([0.025, 0.025, 0.95, 0.95], polar=True)

N = 8
theta = np.arange(0.0, 2*np.pi, 2*np.pi/N)
radii = np.random.rand(N)
width = np.pi/4*np.random.rand(N)
bars = plt.bar(theta, radii, width=width, bottom=0.0)

for r, bar in zip(radii, bars):
    bar.set_facecolor(plt.cm.jet(r))
    bar.set_alpha(0.5)
